eLearning Course: Videos / Animations
NOTE: Due to security, full versions of eLearning courses cannot be shared, and some content has been reacted from work samples. Videos on this page highlight Articulate 360 skills and how they are used.
CLIENT: Defense Logistics Agency (DLA)
PROJECT: eLearning Curriculum Development
ROLE: Director of Learning & Communication
TEAM: Andrea Shimko, Instructional Design Lead · Karla Jang, Instructional Designer · Marie Gist, Instructional Designer · Ellie Kurth, Writer/Editor · Lucas Freitas, Motion Graphics Designer
OVERVIEW: Designed a comprehensive eLearning curriculum to support training and professional development across DLA supply chain and logistics programs.
FOCUS: Instructional design, curriculum structure, visual learning design, and accessibility-compliant content development.
IMPACT: Delivered a standardized, scalable learning experience that improved knowledge consistency, supported workforce readiness, and ensured Section 508–compliant access for all learners.
TOOLS & SKILLS: Articulate 360 (Storyline & Rise) · Learning Experience Design · Instructional Design · Accessibility (Section 508) · Visual Design · Adobe After Effects · Adobe Illustrator · Adobe Premiere
Board Game: The module has learners move through a board game as they learn and test their knowledge to get to the finish line.
PRACTICE: Instead of learners simply observing the work, learners must actually use the resources taught to complete a job task.
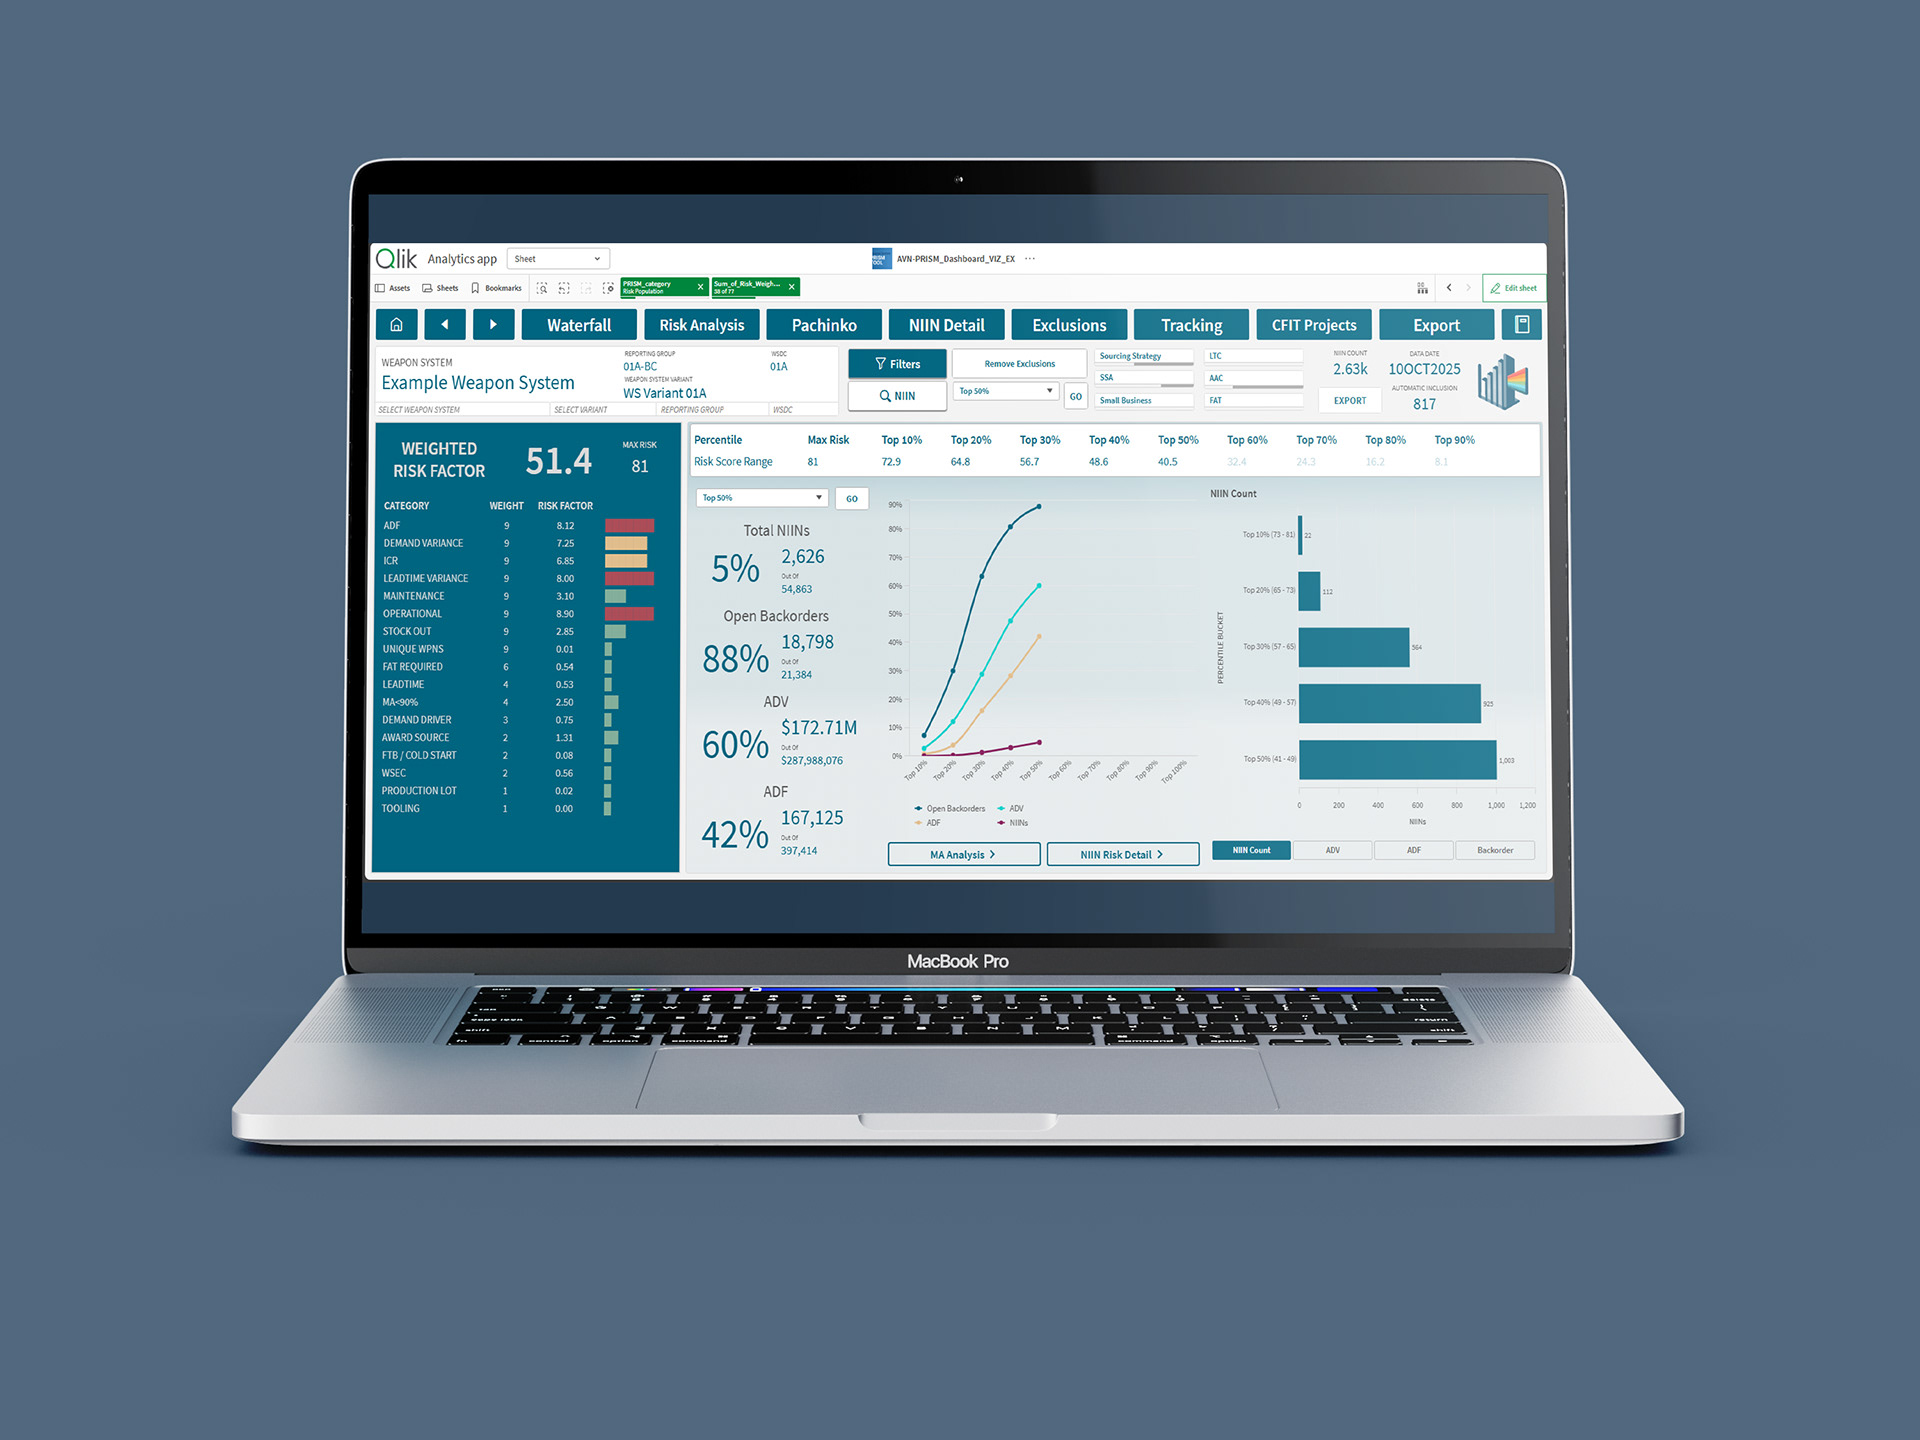
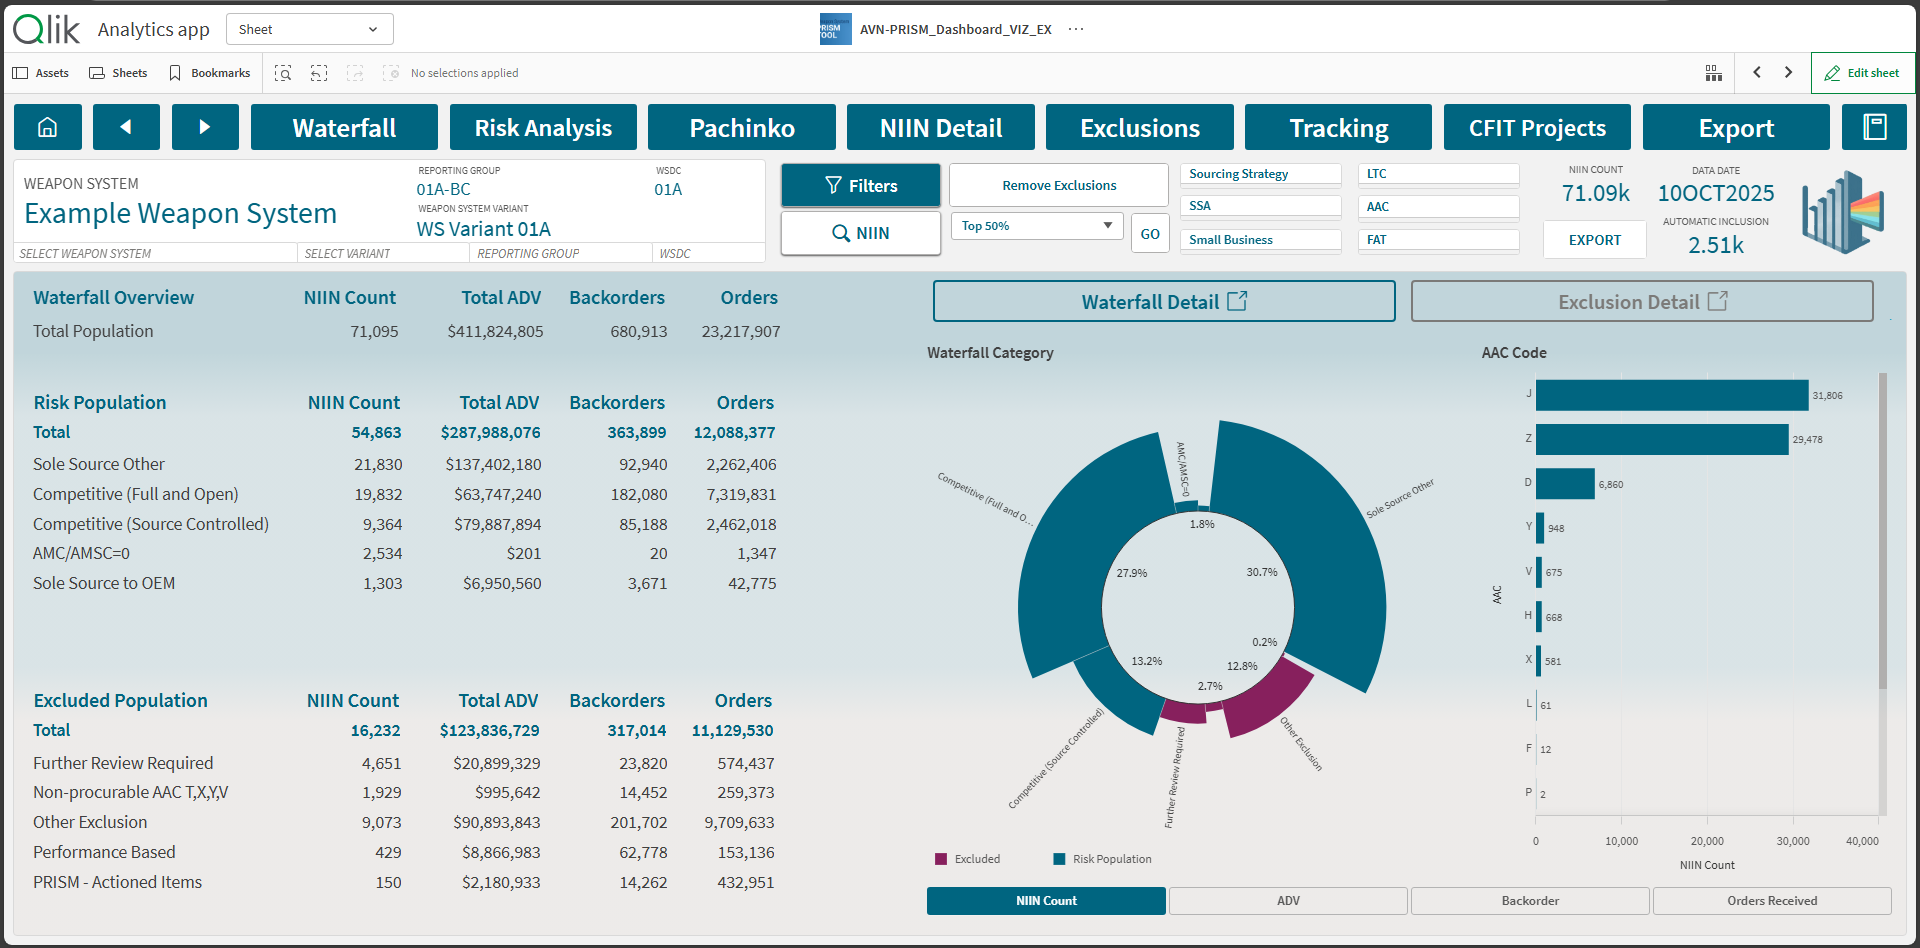
DLA Prism Dashboard
NOTE: Due to security, data was altered and cannot be shared. Videos on this page highlight UX Design and Data Management skills and how they are used.
CLIENT: Defense Logistics Agency
PROJECT: PRISM Dashboard – UX Design
ROLE: UX Designer / Project Manager
OVERVIEW: Designed a user-centered analytics dashboard to provide leadership with clear, actionable insight into Performance-Based Logistics (PBL) risk and performance.
FOCUS: Dashboard UX, information hierarchy, data visualization, and executive usability.
IMPACT: Improved visibility into performance and risk indicators, enabling faster, data-informed decision-making and more effective leadership oversight.
TOOLS & SKILLS: UX Design · Data Visualization · Dashboard Design · Information Architecture · Analytics
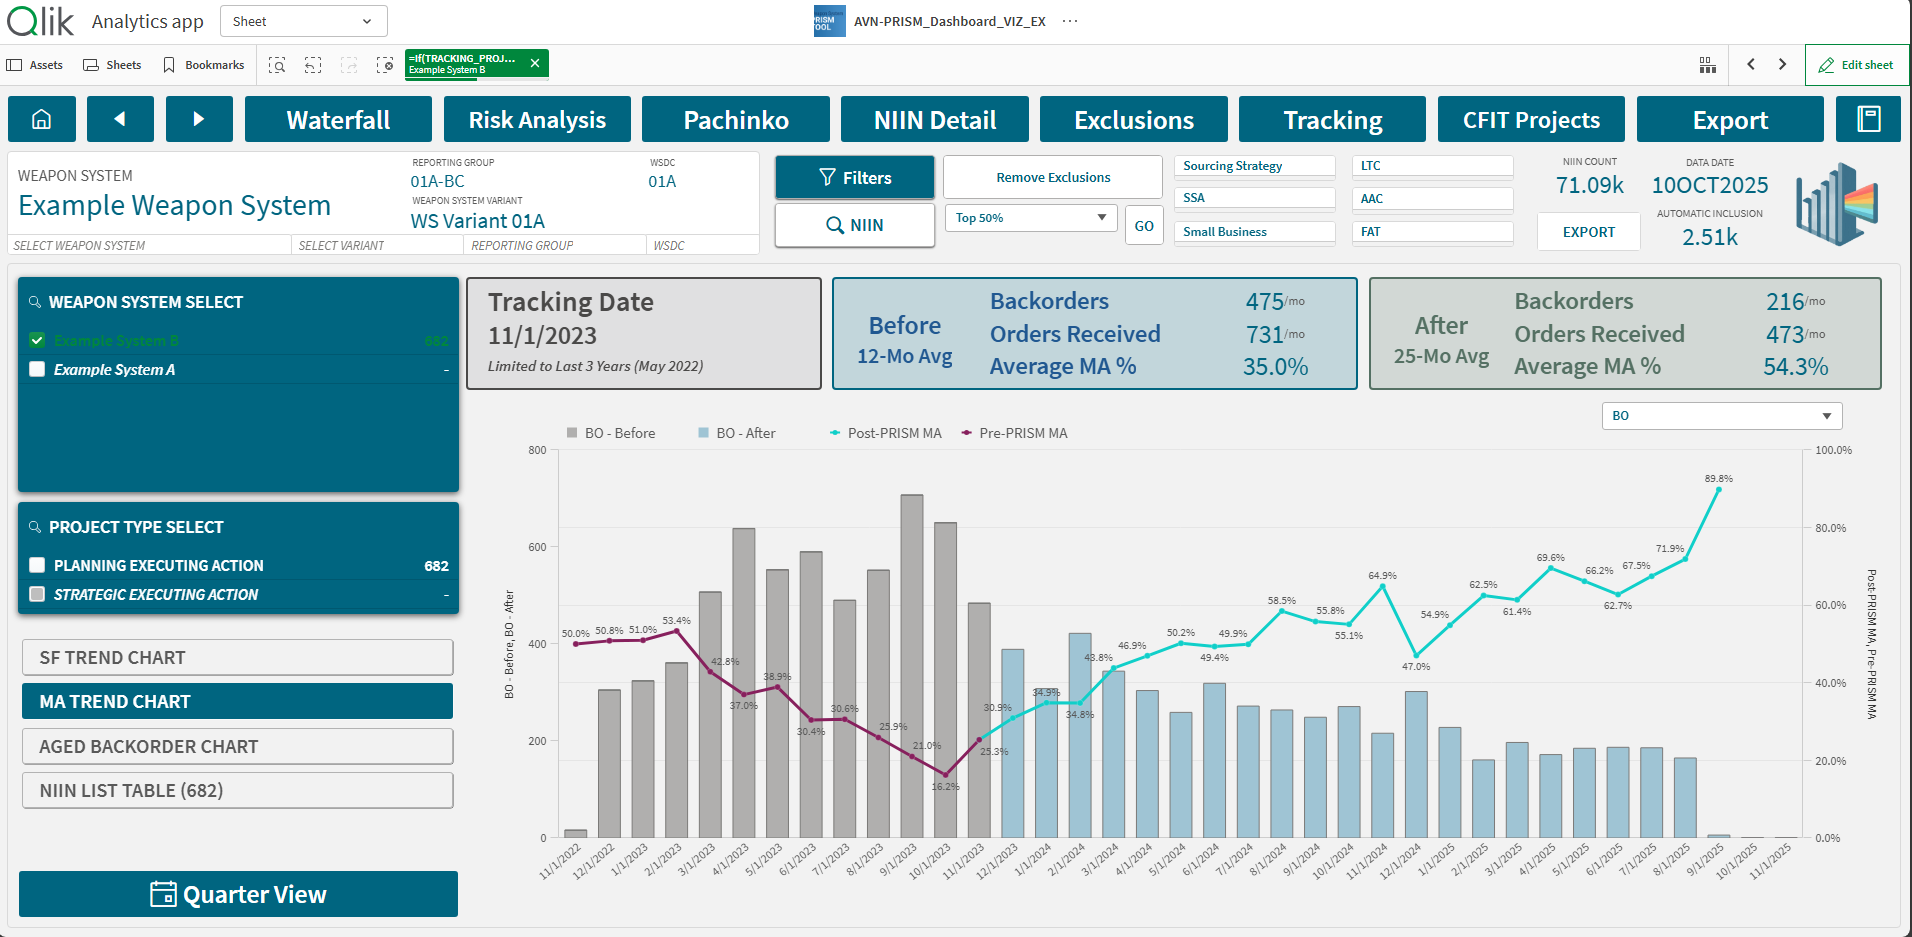
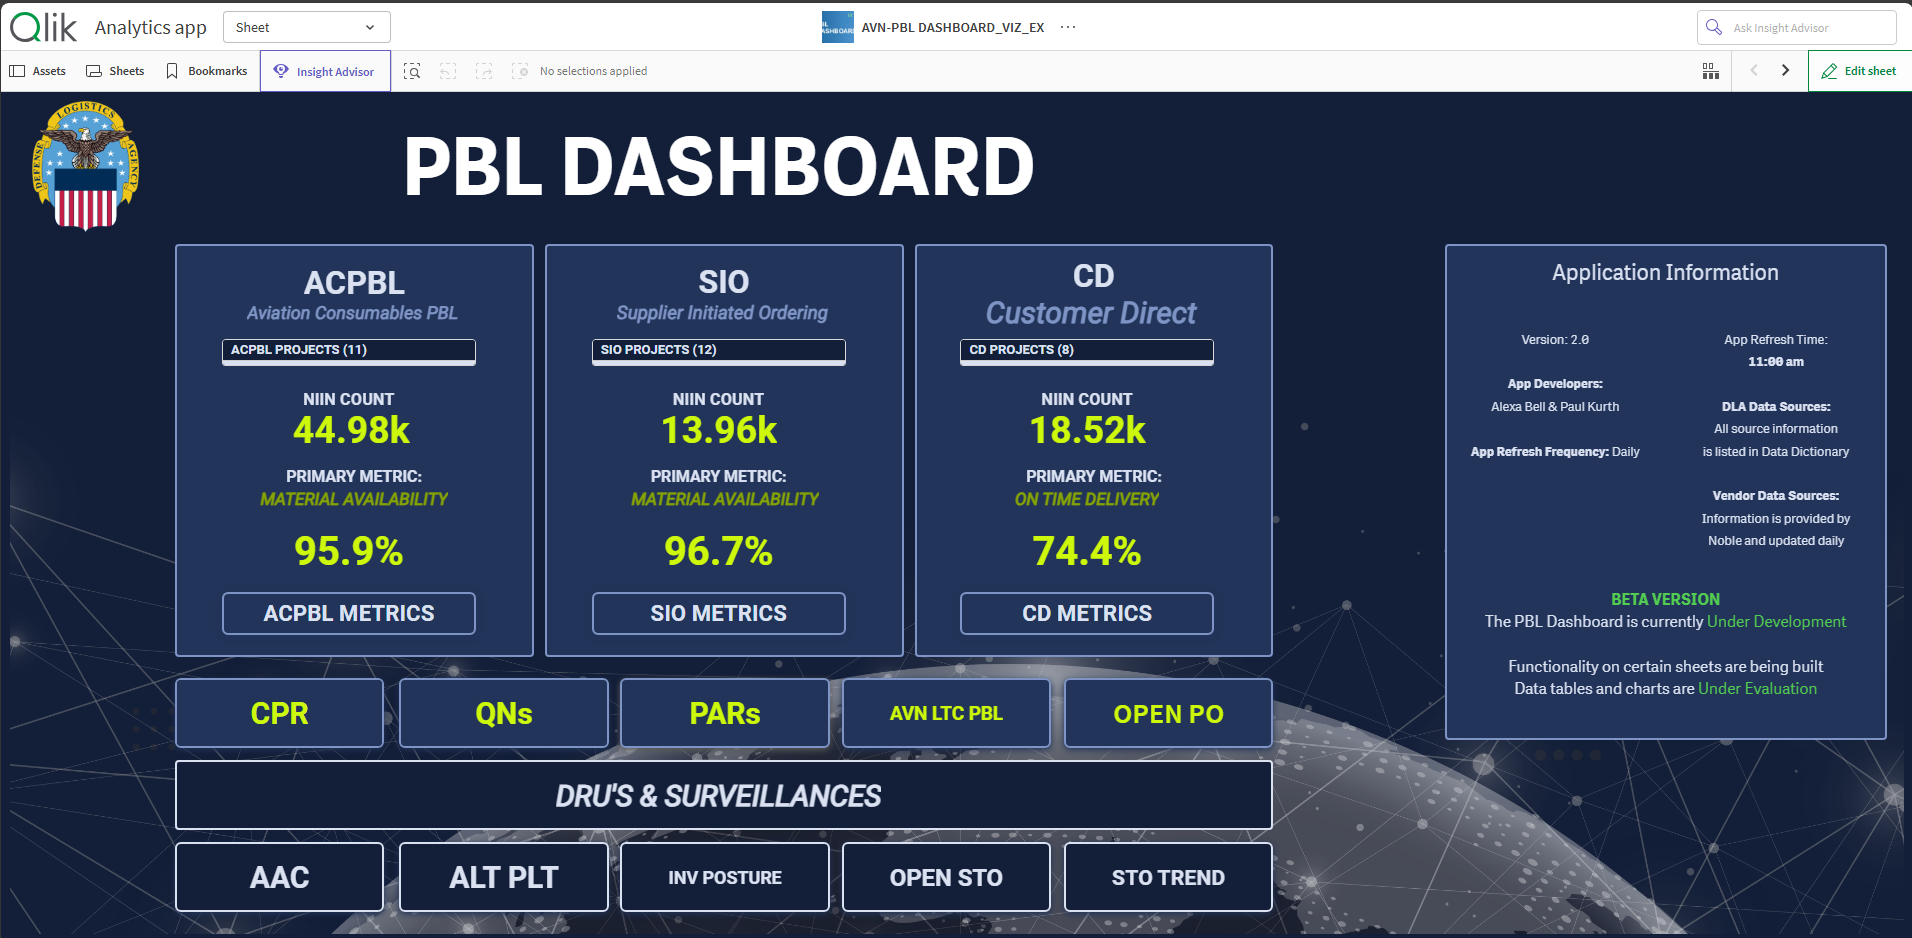
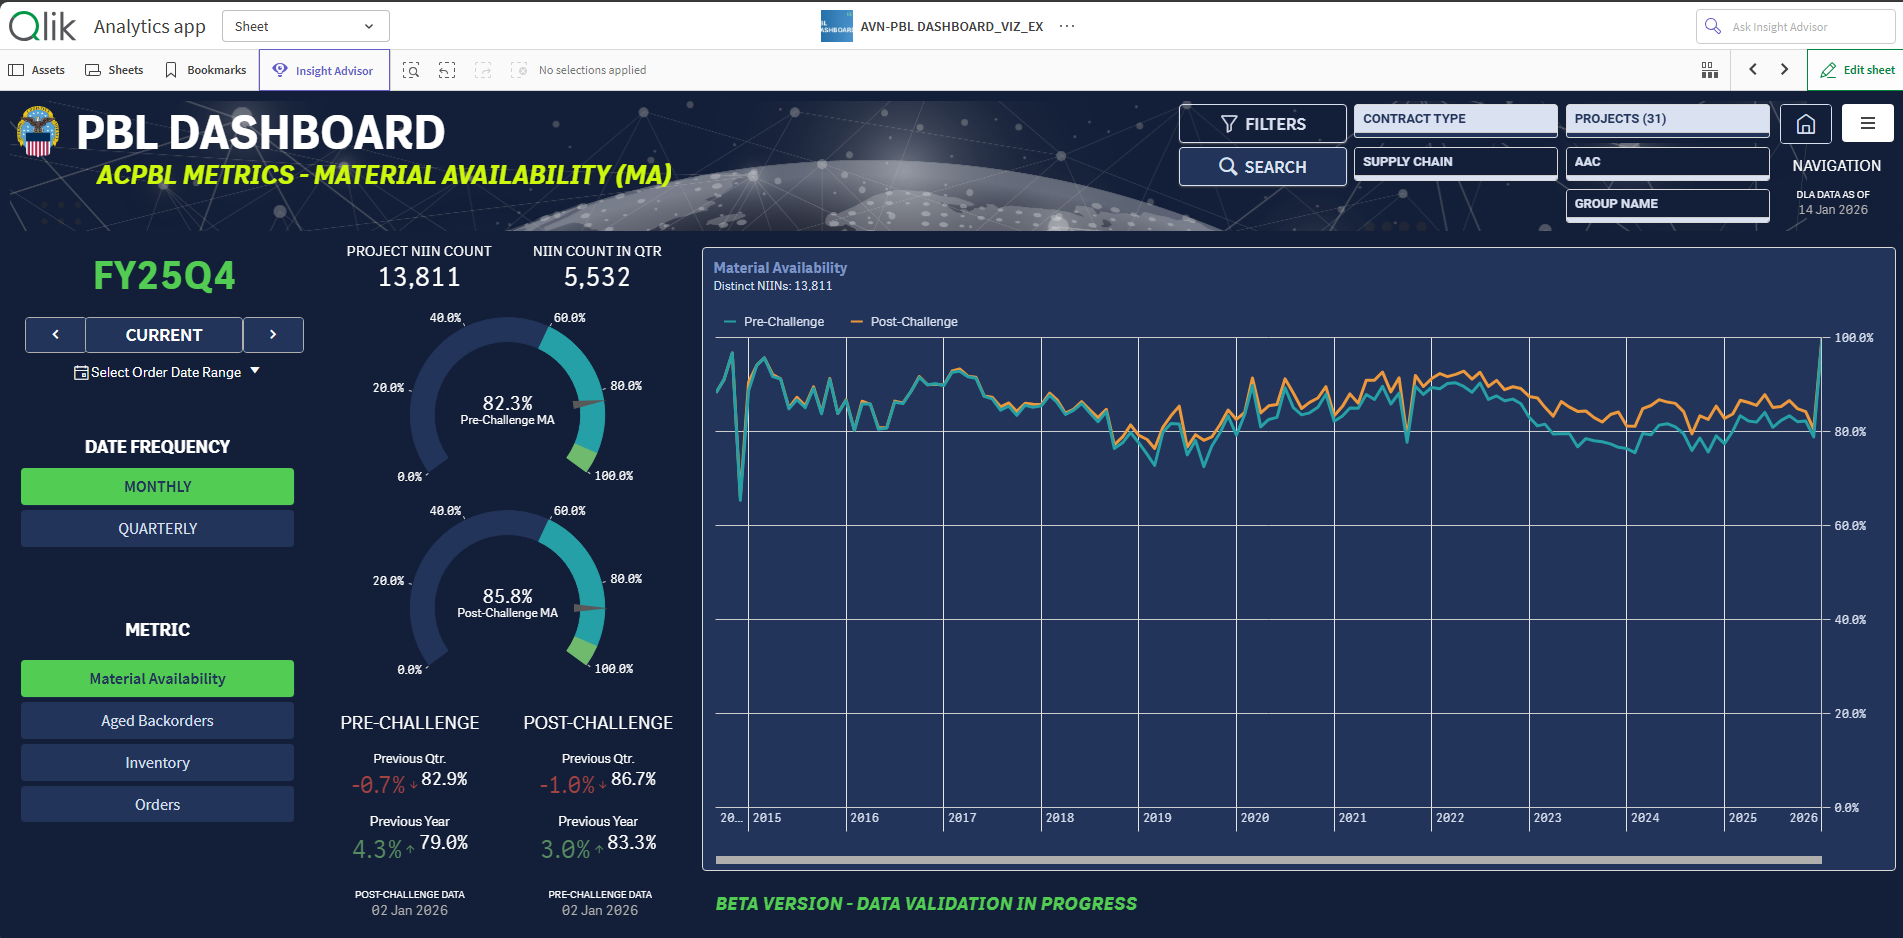
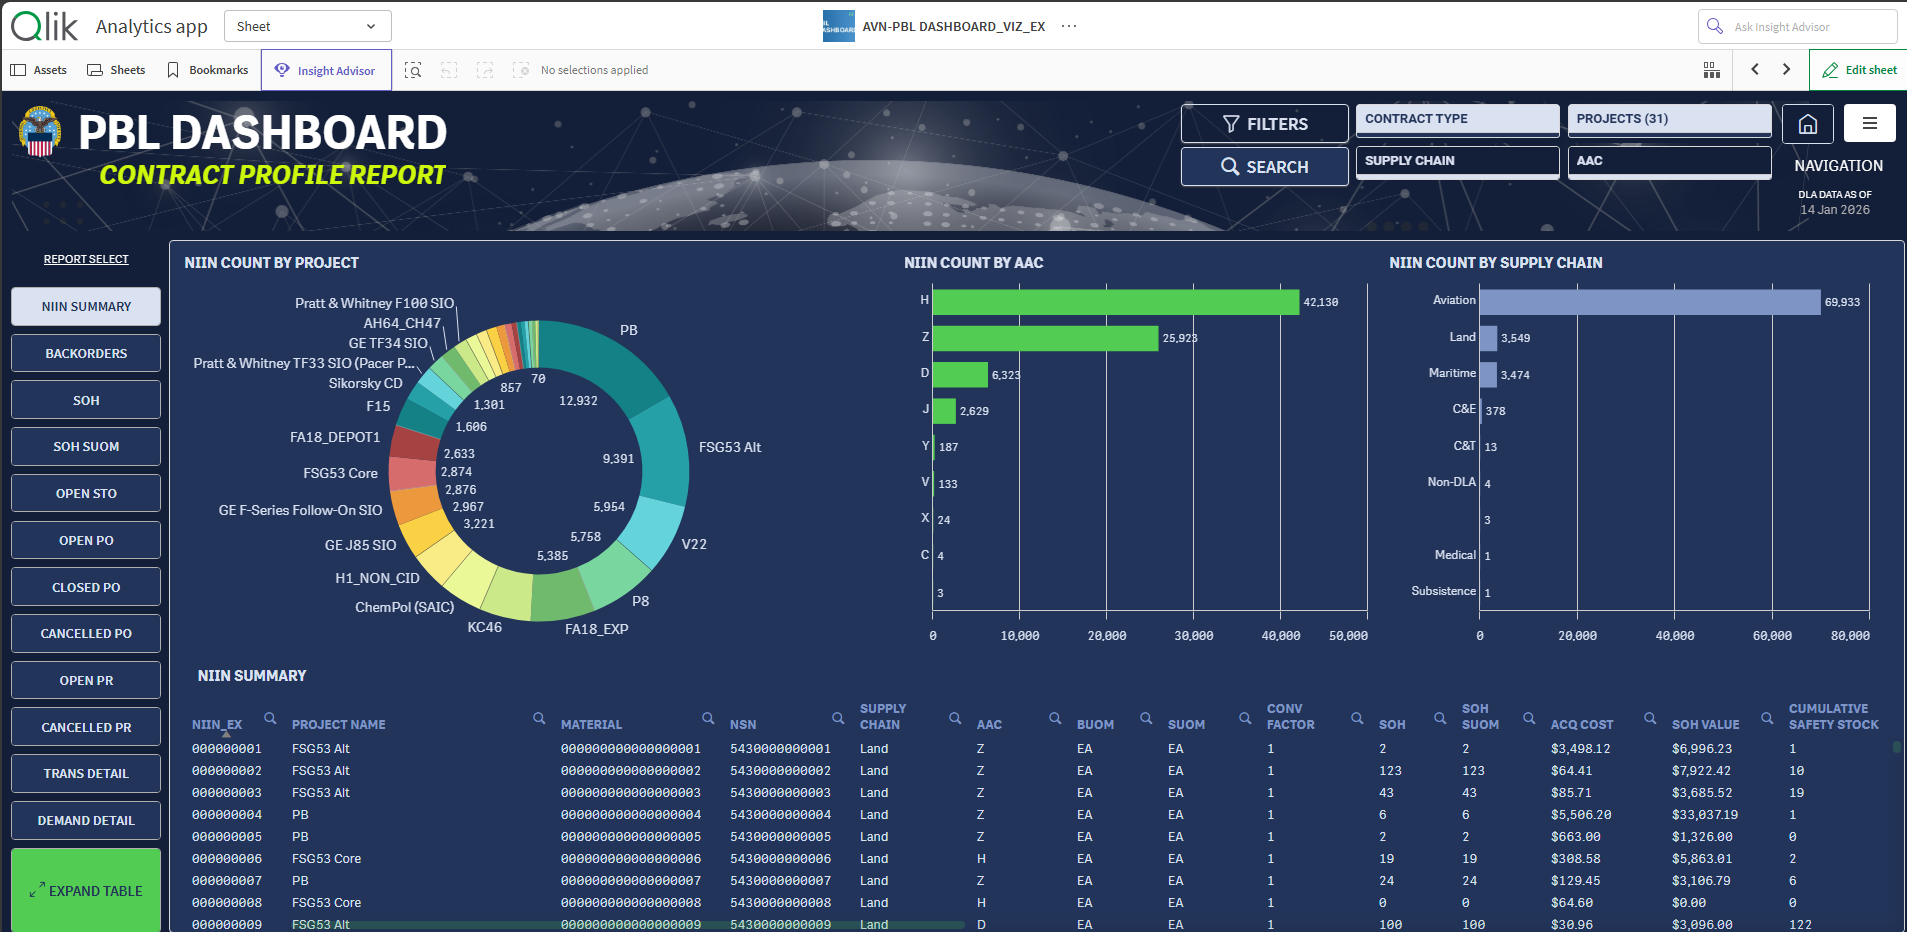
DLA Performance Based Logisitics Dashboard
NOTE: Due to security, data was altered and cannot be shared. Videos on this page highlight UX Design and Data Management skills and how they are used.
CLIENT: Defense Logistics Agency (DLA)
PROJECT: Performance-Based Logistics (PBL) Dashboard
ROLE: UX Designer / Analytics Strategy Lead
OVERVIEW: Designed an enterprise analytics dashboard to track key performance metrics across DLA’s Performance-Based Logistics programs.
FOCUS: UX design, data visualization strategy, metric standardization, and executive dashboard usability.
IMPACT: Improved visibility into program performance and trends, enabling leadership to monitor outcomes, identify risks, and make data-informed decisions across PBL programs.
TOOLS & SKILLS: UX Design · Data Visualization · Dashboard Design · Analytics Strategy
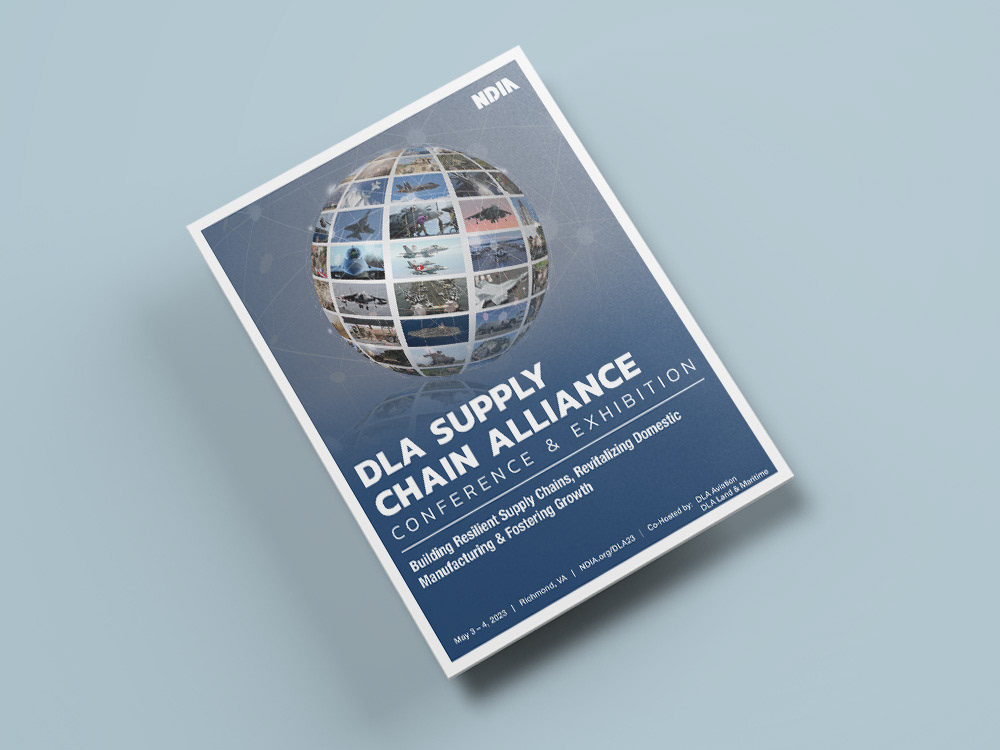
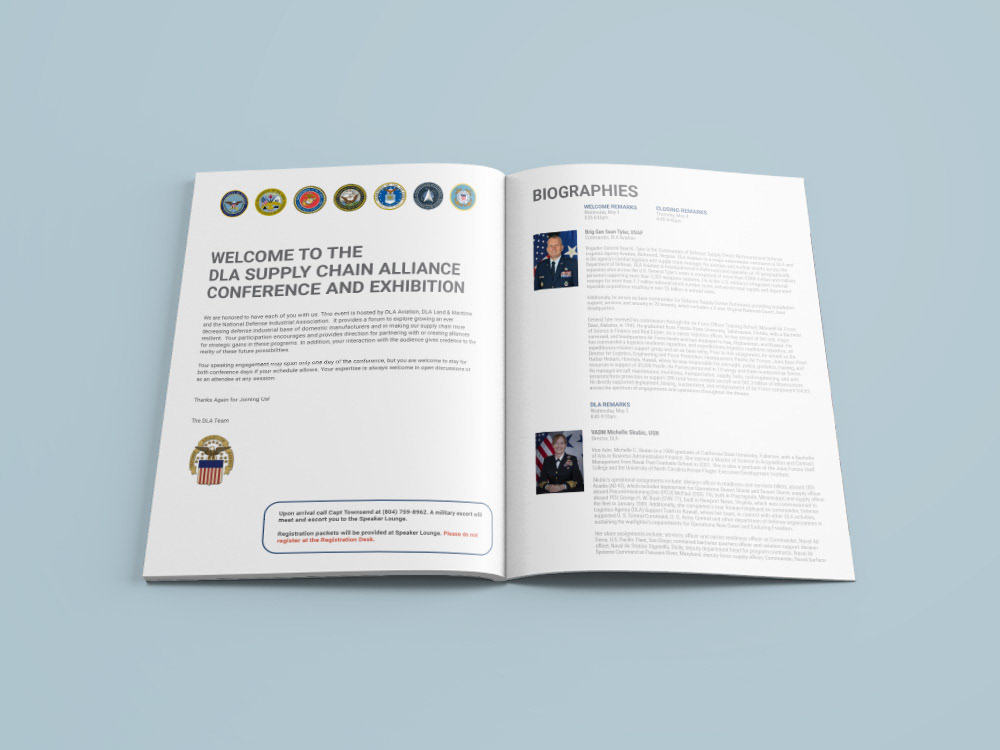
DLA Supply Chain Alliance